Reports
Nextflow provides several reporting mechanisms to monitor, debug, and analyze pipeline executions:
Execution log: Query past pipeline runs without re-executing them
Execution report: Generate an HTML report with resource usage metrics and task details
Trace file: Create a file with detailed task metrics for custom analysis
Execution timeline: Display a visual timeline showing task execution and scheduling
Workflow diagram: Produce a graph visualization of pipeline structure
Execution log
The nextflow log command helps you debug pipelines and inspect execution metadata. You can query by run name or session ID, and the command provides multiple options to filter and format the output.
nextflow log <run_name> [options]
By default, log prints a list of pipeline runs:
$ nextflow log
TIMESTAMP            RUN NAME         SESSION ID                            COMMAND
2025-12-09 11:43:18     1s              naughty_heisenberg      OK      2ce0b0e294      bae65ec6-a2b9-49bf-b63e-2fec91945e48    nextflow run hello
2025-12-09 11:43:28     931ms           thirsty_swanson         OK      2ce0b0e294      bae65ec6-a2b9-49bf-b63e-2fec91945e48    nextflow run hello -resume
2025-12-09 11:43:37     8.5s            goofy_kilby             OK      ca20a6dfd2      d0a60572-076e-451a-b10e-16059ed77e36    nextflow run rnaseq-nf -profile conda
You can specify a run name or session ID prints tasks executed by that pipeline run:
$ nextflow log goofy_kilby
/Users/user/workspace/work/e1/fc2d06782f8263476426c576888033
/Users/user/workspace/work/72/f0542cfa81ad6abeaf1adf02e5cc2b
/Users/user/workspace/work/83/009346a3958358bb704e996d935c7a
/Users/user/workspace/work/84/15e4cd16df1db6f9bc0e22cc05316d
Note
The nextflow log command works retroactively and does not require advance configuration. In contrast, execution reports, trace files, and timelines must be enabled with their respective flags (-with-report, -with-trace, -with-timeline) when running the pipeline.
Customizing fields
The -f (-fields) option specifies a custom list of log fields to include in a printed log.
nextflow log <run_name> -f [fields]
You can set a custom list of fields to focus on specific information. For example, hash, name, exit, and status:
$ nextflow log goofy_kilby -f hash,name,exit,status
e1/fc2d06       RNASEQ:INDEX  (ggal_1_48850000_49020000) 0       COMPLETED
72/f0542c       RNASEQ:FASTQC (ggal_gut)                 0       COMPLETED
83/009346       RNASEQ:QUANT  (ggal_gut)                 0       COMPLETED
84/15e4cd       MULTIQC                                  0       COMPLETED
Optional fields include script, stdout, stderr, env, and fields accessible from the trace report. See log for a full list of available fields or run the log command with the -l option.
Tip
Use the script field to examine script commands run in each task:
$ nextflow log goofy_kilby -f name,status,script
RNASEQ:FASTQC (ggal_gut)        COMPLETED
    fastqc.sh "ggal_gut" "ggal_gut_1.fq ggal_gut_2.fq"
...
Templates
The -t option specifies a template (string or file) to generate custom reports in any text-based format.
nextflow log <run_name> -t <template> > <report>
You can create a template. For example, in Markdown:
## $name

script:

    $script

exit status: $exit
task status: $status
task folder: $folder
Then, use it to create a report:
nextflow log goofy_kilby -t my-template.md > execution-report.md
Filtering
The filter option selects which entries to include in log reports.
nextflow log <run_name> -filter '<filters>'
Any valid Groovy boolean expression on the log fields can be used to define the filter condition. For example, you can filter for task names matching a pattern:
nextflow log goofy_kilby -filter 'name =~ /RNA.*/'
/Users/user/workspace/work/e1/fc2d06782f8263476426c576888033
/Users/user/workspace/work/72/f0542cfa81ad6abeaf1adf02e5cc2b
/Users/user/workspace/work/83/009346a3958358bb704e996d935c7a
Execution report
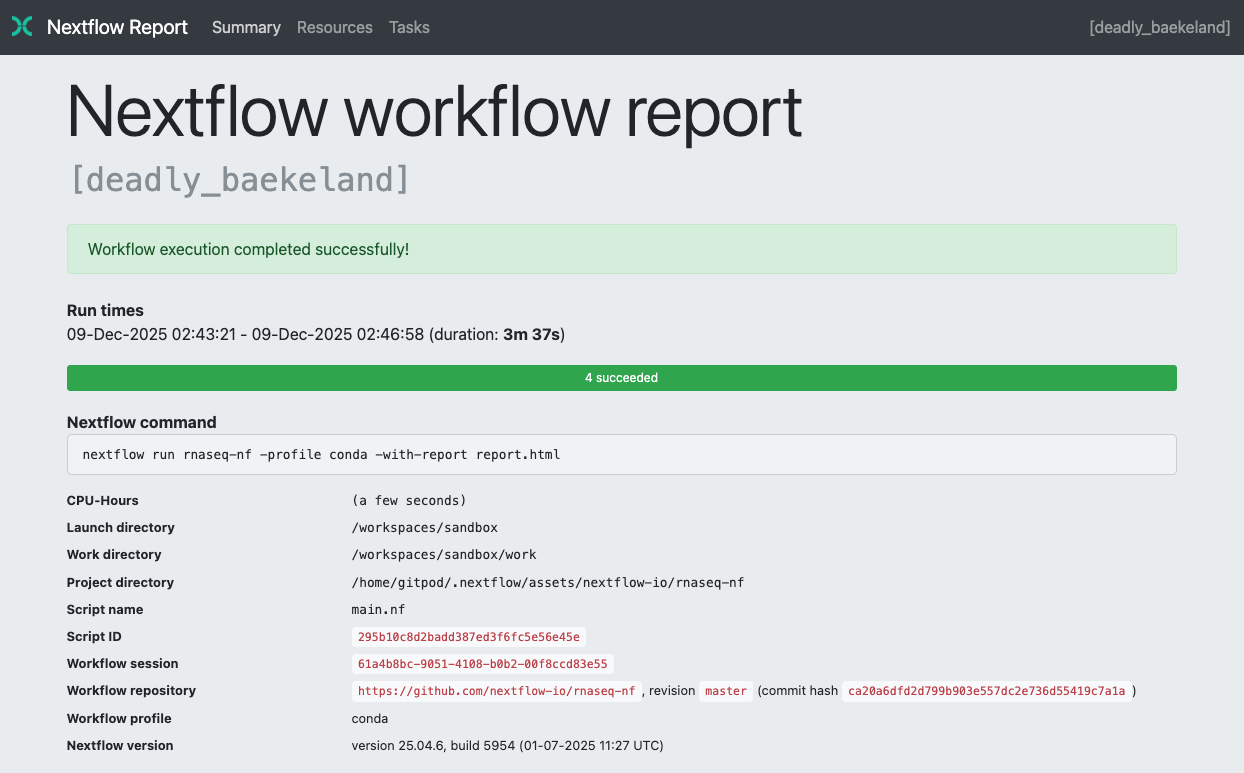
You can create an HTML execution report that includes metrics about a workflow execution. The report is organized in three sections: Summary, Resources, and Tasks.
To enable the creation of this report, add the -with-report command line option when launching the pipeline execution:
nextflow run <pipeline> -with-report [file_name]
You can optionally specify a file name after the -with-report option.
Summary
The Summary section reports the execution status, the launch command, overall execution time, and other workflow metadata:
Resource usage
The Resources section plots the distribution of resource usage for each workflow process using the interactive plotly.js plotting library.
Plots are shown for CPU, memory, job duration and disk I/O. They have two or three tabs with the raw values and a percentage representation showing what proportion of the requested resources were used. These plots are helpful to check that task resources are used efficiently.
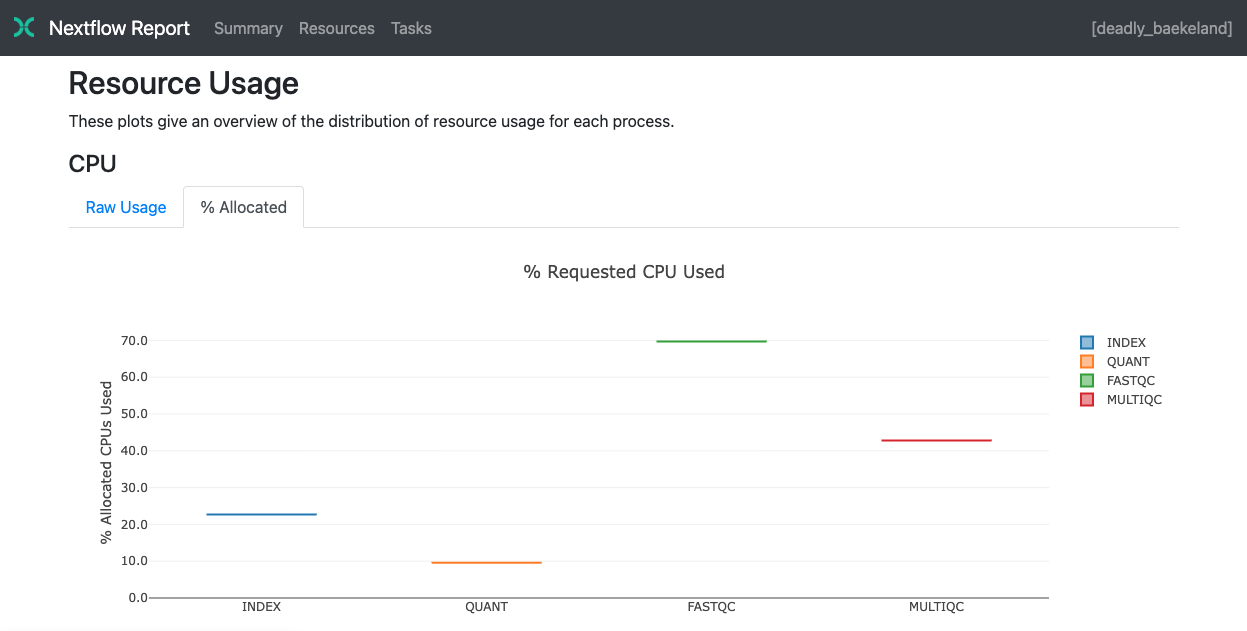
For information about how resource usage is computed, see Understanding task resource metrics.
Tasks
The Tasks section lists all executed tasks, reporting the status, command script, and other metrics for each task:
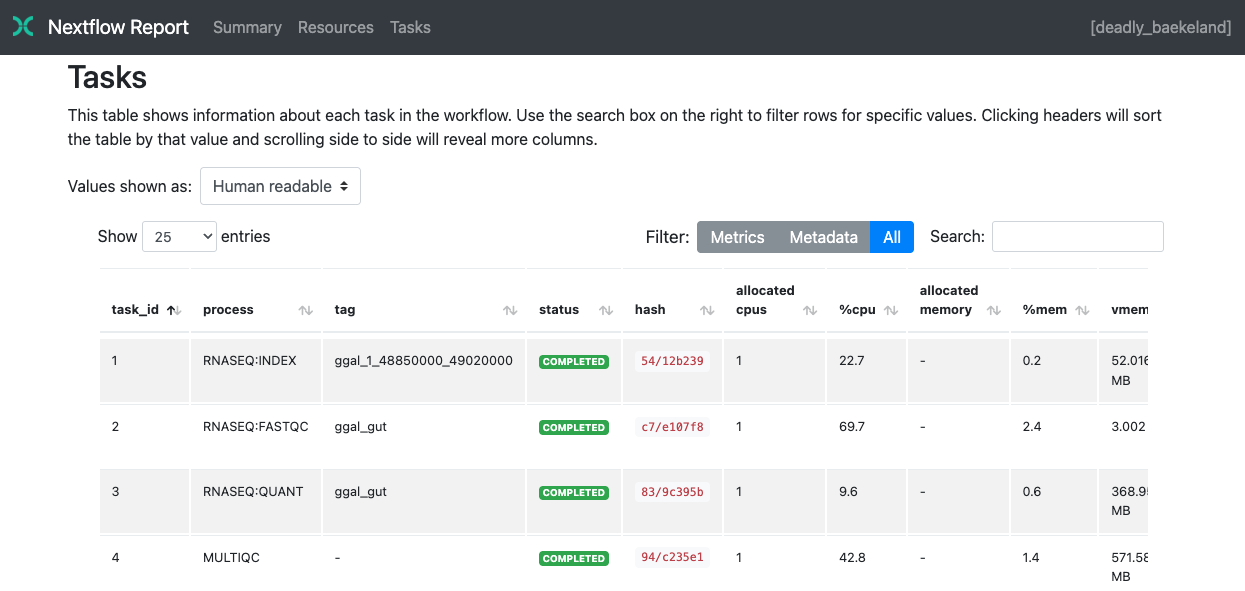
Nextflow collects these metrics through a background process for each job in the target environment. Make sure the following tools are available in the environment where tasks are executed: awk, date, grep, ps, sed, tail, tee. Third-party container image that do not include one or more of the above utilities cause empty execution reports. Some metrics are not reported when running on macOS. For more information, see Report scope.
Trace file
The trace file contains information about each process executed in your pipeline script, including submission time, start time, completion time, CPU, and memory used.
To create the execution trace file, add the -with-trace command line option when launching the pipeline execution:
nextflow run <pipeline> -with-trace
The above command creates a file named trace.txt in the current directory. For example:
task_id |
hash |
native_id |
name |
status |
exit |
submit |
duration |
realtime |
%cpu |
peak_rss |
peak_vmem |
rchar |
wchar |
|---|---|---|---|---|---|---|---|---|---|---|---|---|---|
19 |
45/ab752a |
2032 |
blast (1) |
COMPLETED |
0 |
2014-10-23 16:33:16.288 |
1m |
5s |
0.0% |
29.8 MB |
354 MB |
33.3 MB |
0 |
20 |
72/db873d |
2033 |
blast (2) |
COMPLETED |
0 |
2014-10-23 16:34:17.211 |
30s |
10s |
35.7% |
152.8 MB |
428.1 MB |
192.7 MB |
1 MB |
21 |
53/d13188 |
2034 |
blast (3) |
COMPLETED |
0 |
2014-10-23 16:34:17.518 |
29s |
20s |
4.5% |
289.5 MB |
381.6 MB |
33.3 MB |
0 |
22 |
26/f65116 |
2035 |
blast (4) |
COMPLETED |
0 |
2014-10-23 16:34:18.459 |
30s |
9s |
6.0% |
122.8 MB |
353.4 MB |
33.3 MB |
0 |
23 |
88/bc00e4 |
2036 |
blast (5) |
COMPLETED |
0 |
2014-10-23 16:34:18.507 |
30s |
19s |
5.0% |
195 MB |
395.8 MB |
65.3 MB |
121 KB |
24 |
74/2556e9 |
2037 |
blast (6) |
COMPLETED |
0 |
2014-10-23 16:34:18.553 |
30s |
12s |
43.6% |
140.7 MB |
432.2 MB |
192.7 MB |
182.7 MB |
28 |
b4/0f9613 |
2041 |
exonerate (1) |
COMPLETED |
0 |
2014-10-23 16:38:19.657 |
1m 30s |
1m 11s |
94.3% |
611.6 MB |
693.8 MB |
961.2 GB |
6.1 GB |
32 |
af/7f2f57 |
2044 |
exonerate (4) |
COMPLETED |
0 |
2014-10-23 16:46:50.902 |
1m 1s |
38s |
36.6% |
115.8 MB |
167.8 MB |
364 GB |
5.1 GB |
33 |
37/ab1fcc |
2045 |
exonerate (5) |
COMPLETED |
0 |
2014-10-23 16:47:51.625 |
30s |
12s |
59.6% |
696 MB |
734.6 MB |
354.3 GB |
420.4 MB |
31 |
d7/eabe51 |
2042 |
exonerate (3) |
COMPLETED |
0 |
2014-10-23 16:45:50.846 |
3m 1s |
2m 6s |
130.1% |
703.3 MB |
760.9 MB |
1.1 TB |
28.6 GB |
36 |
c4/d6cc15 |
2048 |
exonerate (6) |
COMPLETED |
0 |
2014-10-23 16:48:48.718 |
3m 1s |
2m 43s |
116.6% |
682.1 MB |
743.6 MB |
868.5 GB |
42 GB |
30 |
4f/1ad1f0 |
2043 |
exonerate (2) |
COMPLETED |
0 |
2014-10-23 16:45:50.961 |
10m 2s |
9m 16s |
95.5% |
706.2 MB |
764 MB |
1.6 TB |
172.4 GB |
52 |
72/41d0c6 |
2055 |
similarity (1) |
COMPLETED |
0 |
2014-10-23 17:13:23.543 |
30s |
352ms |
0.0% |
35.6 MB |
58.3 MB |
199.3 MB |
7.9 MB |
57 |
9b/111b5e |
2058 |
similarity (6) |
COMPLETED |
0 |
2014-10-23 17:13:23.655 |
30s |
488ms |
0.0% |
108.2 MB |
158 MB |
317.1 MB |
9.8 MB |
53 |
3e/bca30f |
2061 |
similarity (2) |
COMPLETED |
0 |
2014-10-23 17:13:23.770 |
30s |
238ms |
0.0% |
6.7 MB |
29.6 MB |
190 MB |
91.2 MB |
54 |
8b/d45b47 |
2062 |
similarity (3) |
COMPLETED |
0 |
2014-10-23 17:13:23.808 |
30s |
442ms |
0.0% |
108.1 MB |
158 MB |
832 MB |
565.6 MB |
55 |
51/ac19c6 |
2064 |
similarity (4) |
COMPLETED |
0 |
2014-10-23 17:13:23.873 |
30s |
6s |
0.0% |
112.7 MB |
162.8 MB |
4.9 GB |
3.9 GB |
56 |
c3/ec5f4a |
2066 |
similarity (5) |
COMPLETED |
0 |
2014-10-23 17:13:23.948 |
30s |
616ms |
0.0% |
10.4 MB |
34.6 MB |
238 MB |
8.4 MB |
98 |
de/d6c0a6 |
2099 |
matrix (1) |
COMPLETED |
0 |
2014-10-23 17:14:27.139 |
30s |
1s |
0.0% |
4.8 MB |
42 MB |
240.6 MB |
79 KB |
Trace fields
The trace report includes a comma-separated list of fields with detailed metrics for each task.
Note
These metrics provide an estimation of the resources used by running tasks. They are not an alternative to low-level performance analysis tools, and they may not be completely accurate, especially for very short-lived tasks (running for less than a few seconds).
You can configure the trace report layout and other settings in the nextflow.config file. See Trace scope for more information.
Execution timeline
You can render an HTML timeline for all processes executed in your pipeline. The following image shows an example execution timeline:
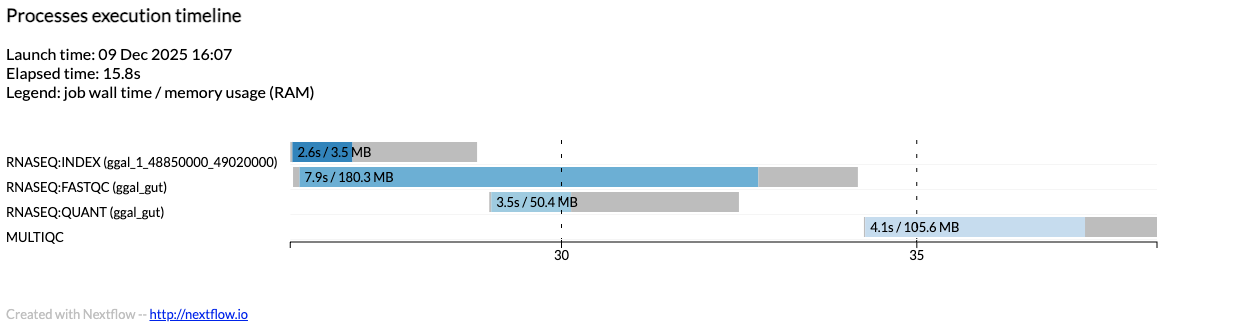
Each bar in the timeline represents a task execution:
Bar length: Total task duration (wall-time)
Colored area: Actual execution time
Gray area (left): Task scheduling wait time
Gray area (right): Task termination time (cleanup and file un-staging)
Numbers on bar: Task duration and peak virtual memory size
Bar color: Identifies tasks from the same process
The x-axis shows time in absolute units (e.g., minutes or hours).
To enable the creation of the execution timeline, add the -with-timeline command line option when launching the pipeline execution:
nextflow run <pipeline> -with-timeline [file_name]
Note
Specifying a file name is optional.
Workflow diagram
A Nextflow pipeline can be represented as a direct acyclic graph (DAG). The vertices in the graph represent the pipeline’s processes and operators, while the edges represent the data dependencies (i.e., channels) between them.
To render the workflow DAG, run your pipeline with the -with-dag option. By default, it creates a file named dag-<timestamp>.html with the workflow DAG rendered as a Mermaid diagram.
The workflow DAG can be rendered in a different format by specifying an output file name with a different extension based on the desired format. For example:
nextflow run <pipeline> -with-dag flowchart.png
Tip
Use the -preview option with -with-dag to render the workflow DAG without executing any tasks.
The following example shows the Mermaid diagram for the rnaseq-nf pipeline (using the Mermaid Live Editor with the default theme):
nextflow run rnaseq-nf -preview -with-dag